Our assessment
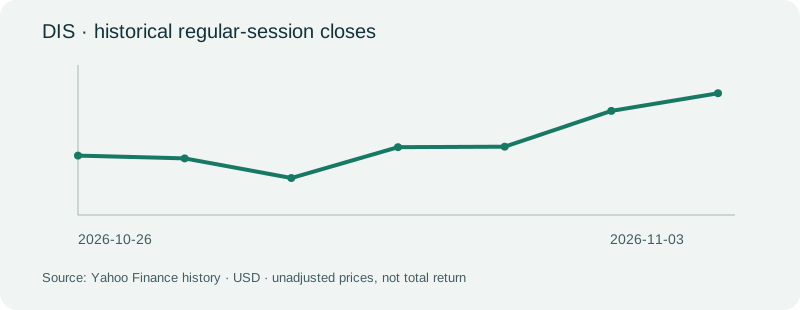
DIS rose 0.95% over the November 3, 2026 regular session, ending at USD 114.18. The fall assumed by the search question does not match that window. Profitable streaming and Experiences support a measured recovery investment, with cash reinvestment and sports costs limiting enthusiasm.
Research updated November 4, 2026; historical price references end at the November 3 regular-session close.
What happened to the share price
DIS finished November 3 at USD 114.18, compared with USD 113.11 at the previous close. Its daily return was +0.95% and five-session return was +3.58%. A positive session can still sit inside a weaker five-session path, just as a daily fall can follow a strong run. These are saved historical regular-session prices, not live quotes or dividend-inclusive total returns.
SVOD operating profit more than doubles in fiscal Q3
August 5 results reported $712 million of Entertainment SVOD operating income and a 12.9% margin, with timing benefits disclosed. The latest operating evidence is dated 2026-08-05, for 2026-06-27. It is relevant to the business outlook, but the price data alone does not establish a single cause of the move.
Does the move make the stock worth buying?
Streaming is a genuine earnings contributor, while group cash reinvestment and segment differences still matter. At $114.18, a staged position is reasonable for investors accepting consumer, content and execution risks; do not assume all adjusted growth is GAAP profit.
A higher price needs more than momentum
Entertainment SVOD revenue reached $5.532 billion and operating income $712 million versus $329 million a year earlier. The 12.9% margin is meaningful, although management said marketing and programming timing helped. The definition excludes Hulu Live TV and Fubo vMVPD. Net income of $2.638 billion and GAAP EPS of $1.51 differ from adjusted EPS of $2.06, so investors should distinguish the segment recovery from total accounting earnings. The growth in streaming earnings is important because it reduces the need for other segments to fund losses. It should still be tested across a full content and marketing cycle, particularly as bundles and distribution agreements change the revenue mix.
The financial evidence behind this view
Latest verified report: The Walt Disney Company Q3 FY2026, published 2026-08-05. Measures retain their stated accounting basis and reporting periods.
| Reported measure | Value and period | Comparison and meaning |
|---|---|---|
| Reported revenue | USD 25.248 billion 2026-03-29/2026-06-27 |
USD 23.650 billion (2025-03-30/2025-06-28). +6.76% change. Reported period value; comparison uses the corresponding prior-year reporting period where available. Source |
| Reported GAAP net income / loss | USD 2.638 billion 2026-03-29/2026-06-27 |
USD 5.262 billion (2025-03-30/2025-06-28). -49.87% change. Reported period value; comparison uses the corresponding prior-year reporting period where available. Source |
| Total segment operating income (company non-GAAP measure) | USD 5.555 billion 2026-03-29/2026-06-27 |
USD 4.575 billion (2025-03-30/2025-06-28). +21.42% change. Not consolidated GAAP operating income; the release reconciles it to income before tax. Source |
| Cash and cash equivalents | USD 5.185 billion 2026-06-27 |
Balance-sheet amount at the stated date; not a quarterly flow. Source |
What the valuation does and does not say
$114.18 / ($6.85 FY2025 diluted EPS + $4.12 nine-month FY2026 – $6.12 nine-month FY2025). Corresponding fiscal periods and common-share basis.
Historical EPS includes accounting and business-cycle effects; this is not a forward earnings estimate.
Frequently asked questions
Did DIS actually fall over this window?
It rose 0.95% over the November 3, 2026 regular session. The daily and five-session comparisons are shown separately.
Would this price move alone change the investment conclusion?
Profitable streaming and Experiences support a measured recovery investment, with cash reinvestment and sports costs limiting enthusiasm.
What would make a new purchase more convincing?
At $114.18, a staged position is reasonable for investors accepting consumer, content and execution risks; do not assume all adjusted growth is GAAP profit.
Discuss the investment case
Join the existing WhatsApp research discussion to compare the business case, valuation and risks. Group participation does not guarantee returns or access to personalized advice.
Sources
Investment opinion for general education, not personalized financial advice. Capital is at risk. Financial observations are dated; estimates and hypothetical examples do not guarantee future returns.